
Every organization relies on reporting to understand performance, guide decisions, and stay aligned. Yet many teams still struggle with fragmented data, delayed insights, and reports that never quite reach the people who need them most. As organizations grow, so does the volume of information, and without the right system in place, reporting becomes reactive rather than strategic.
Modern organizational reporting software addresses this gap by bringing data, context, and communication together. Instead of pulling numbers from disconnected systems and sharing static reports by email, teams can access real-time insights through centralized platforms. Leaders gain visibility into trends and outcomes. Managers track progress against goals. Employees understand how their work connects to broader objectives.
The shift toward hybrid work has only increased the need for accessible, role-based reporting. People expect information to be easy to find, simple to understand, and relevant to their responsibilities. Reporting tools that sit in isolation often fail to drive action. When reporting lives inside a broader digital workplace, adoption improves and insights travel faster.
This is where platforms like Axero play a different role. By combining reporting with intranet capabilities, knowledge sharing, and internal communication, organizations create a single source of truth that people actually use. Before choosing a solution, it’s worth understanding what organizational reporting software really is and what matters most when selecting the right platform.
Top 12 organizational reporting software for 2026
- Axero
- Microsoft Power BI
- Tableau
- SAP Analytics Cloud
- Qlik Sense
- Looker
- Domo
- Zoho Analytics
- Sisense
- IBM Cognos Analytics
- Oracle Analytics Cloud
- Klipfolio
What is organizational reporting software?
Organizational reporting software helps businesses collect, analyze, and present data across teams, departments, and leadership levels. Its purpose is to turn raw data into structured reports, dashboards, and insights that support informed decision-making.
Unlike basic reporting tools that focus on isolated metrics, organizational reporting software looks at performance from a broader perspective. It connects multiple data sources, standardizes reporting, and ensures information flows consistently throughout the organization. This may include operational reports, financial summaries, performance dashboards, compliance tracking, and people analytics.
Effective reporting software does more than display numbers. It provides context. Users can understand trends, identify risks, and monitor progress against goals without relying on manual spreadsheets or one-off reports. Access controls ensure the right people see the right data, while automation reduces reporting delays and human error.
When reporting is embedded within a centralized platform like an intranet, insights become part of daily work. Teams can discuss results, reference documentation, and align actions in one place. This connection between reporting and communication is what turns information into outcomes.
What to consider when choosing the right organizational reporting software
Choosing reporting software requires more than evaluating charts and dashboards. You need a solution that fits how your organization works today and how it plans to operate moving forward.
Data integration and accessibility
Your reporting software should integrate easily with existing systems such as HR platforms, finance tools, and project management software. Centralized access ensures reports remain consistent and trusted across the organization.
Ease of use and adoption
If reports require technical expertise to build or interpret, adoption will suffer. Look for intuitive interfaces, clear visualizations, and self-service reporting that empowers non-technical users.
Role-based reporting and permissions
Different teams need different views. Strong permission controls allow leaders, managers, and employees to access relevant insights without exposing sensitive data.
Context and collaboration
Reporting should not live in isolation. Platforms that connect reports to internal communication, documentation, and updates help teams understand what the data means and what actions to take.
Scalability and governance
As your organization grows, reporting requirements evolve. The right platform supports governance, standardization, and scalability without adding complexity.
Axero addresses these considerations by embedding reporting within a unified digital workplace. This approach ensures insights remain visible, actionable, and aligned with how your teams communicate and collaborate every day.
12 best organizational reporting software
1. Axero
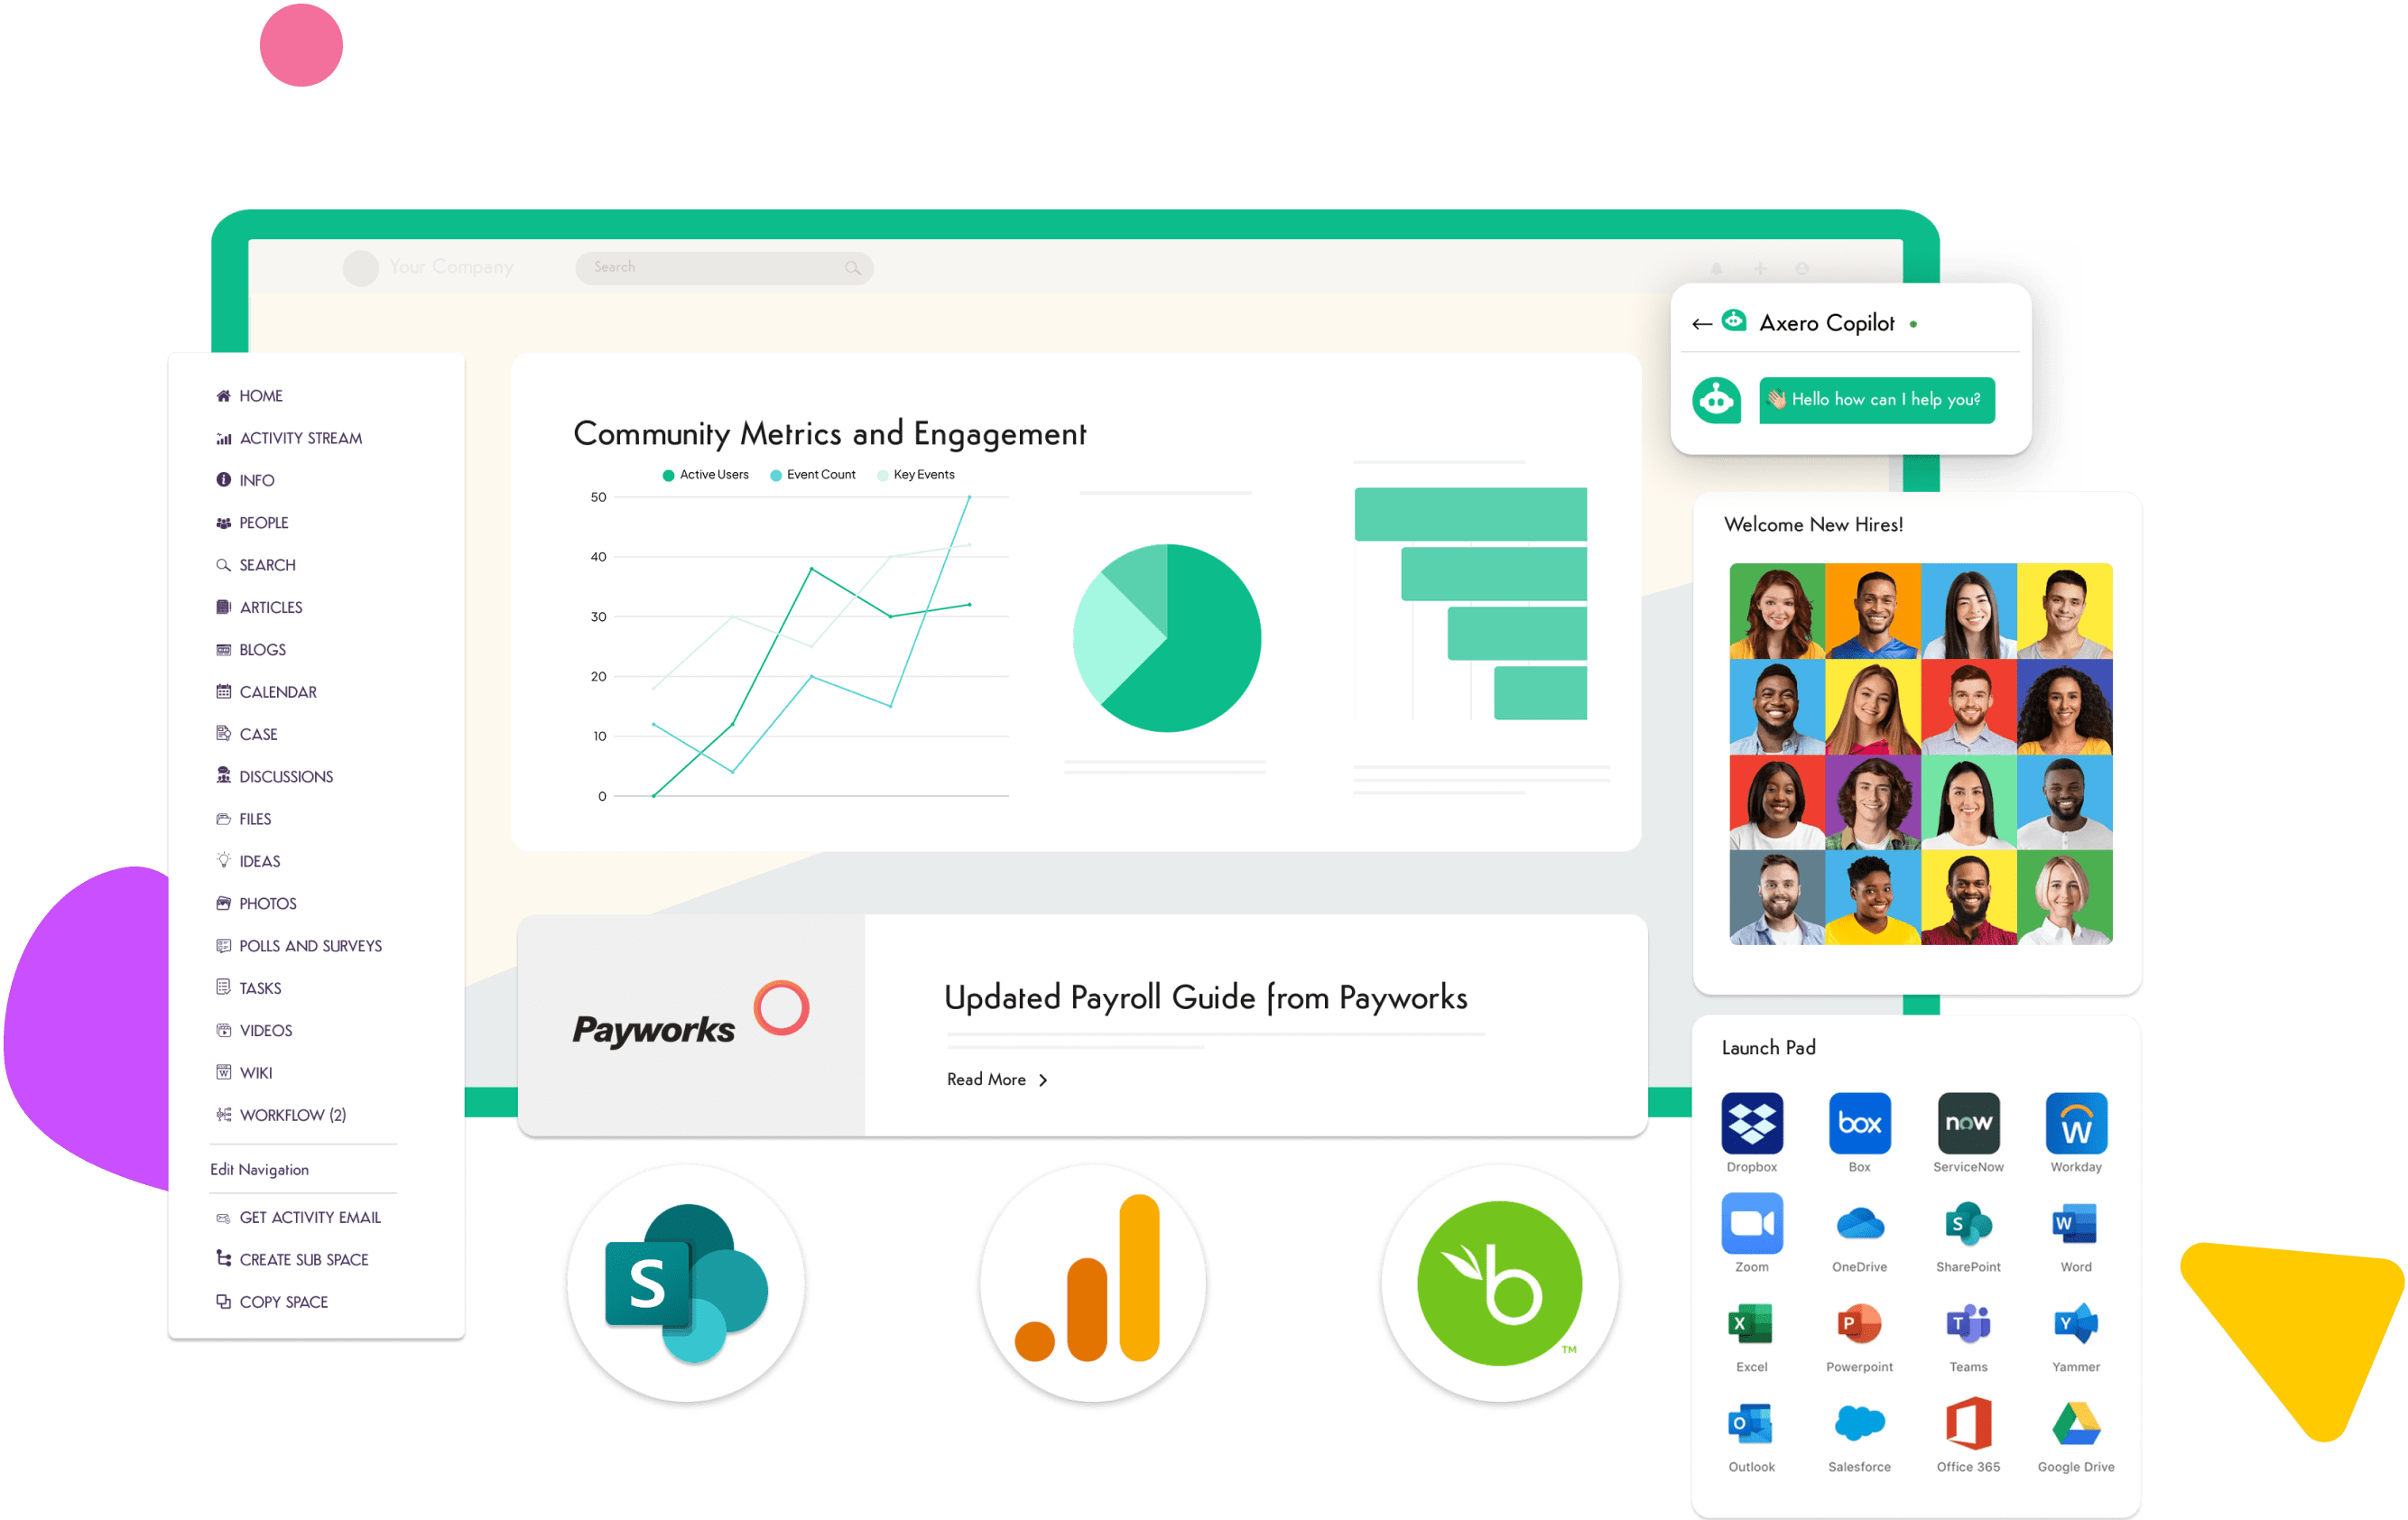
Axero approaches organizational reporting from a broader digital workplace perspective. Rather than treating reporting as a standalone activity, Axero embeds reporting capabilities directly into your intranet, where communication, documentation, and collaboration already live. This ensures reports stay visible, contextual, and aligned with everyday work. With Axero, reporting becomes part of how teams operate, not an extra system they need to remember to check. Leaders can surface key metrics on dashboards tied to departments, initiatives, or goals. Teams can access reports alongside policies, project updates, and internal news, reducing confusion and duplicated effort.
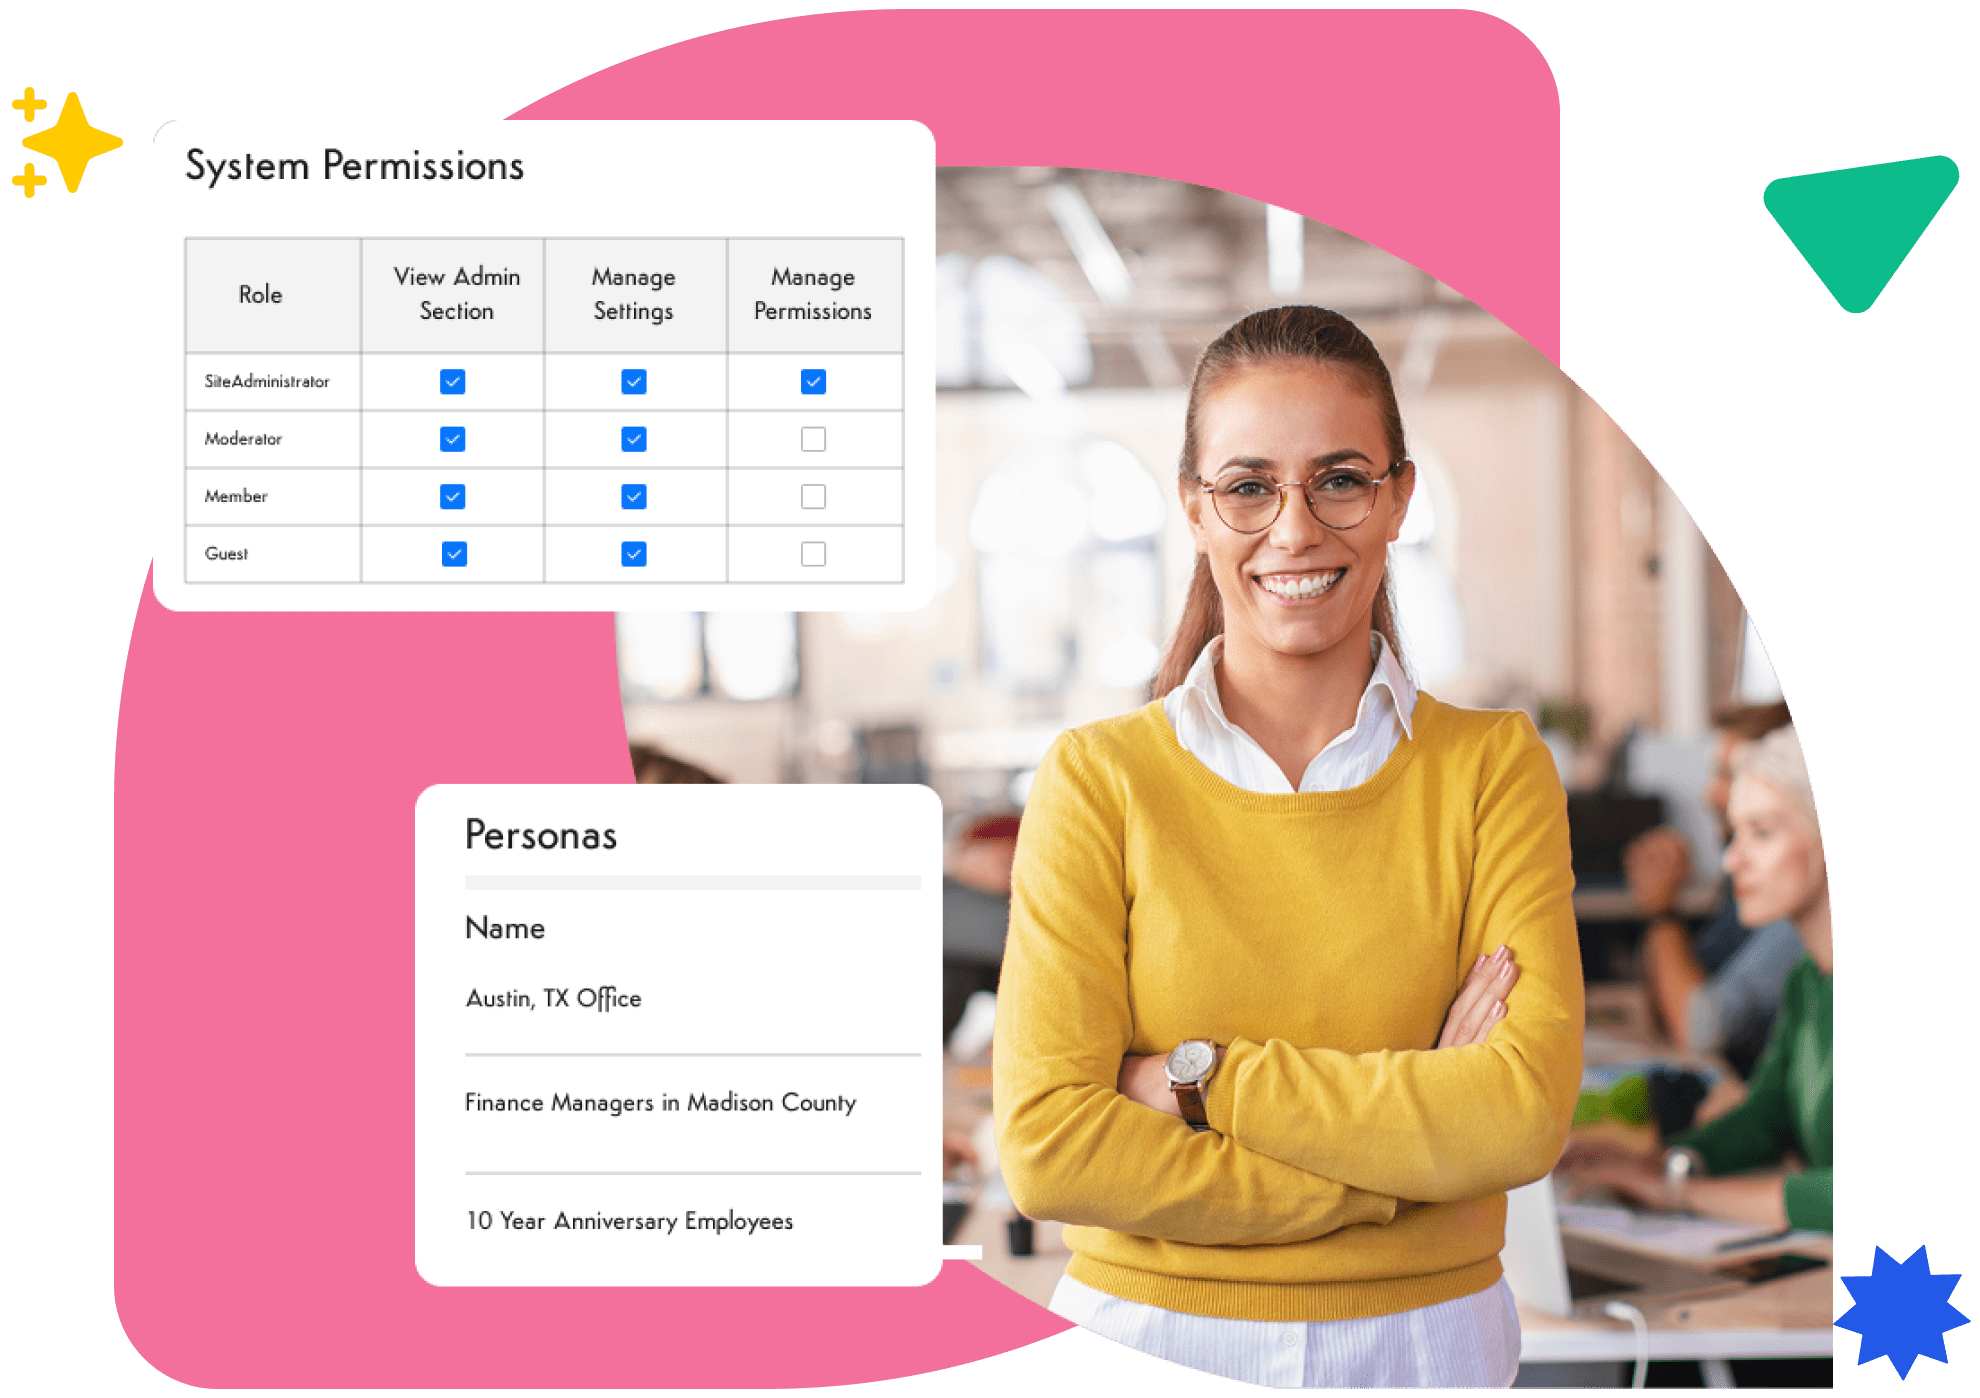
Axero also supports governance and consistency. Reports can be standardized, permissions clearly defined, and updates shared through the same platform employees already trust. This increases adoption and ensures insights reach the right audience at the right time. By connecting reporting with engagement tools, knowledge management, and internal communication, Axero helps organizations move from passive reporting to informed action.
Key features of Axero
- Intranet-embedded reporting: Keeps insights visible within the same platform employees use daily.
- Role-based dashboards: Delivers relevant data to leaders, managers, and teams without overexposure.
- Integrated communication: Connects reports to updates, documentation, and discussion for better alignment.
Best for: Organizations that want reporting fully integrated into their intranet and digital workplace.

2. Microsoft Power BI
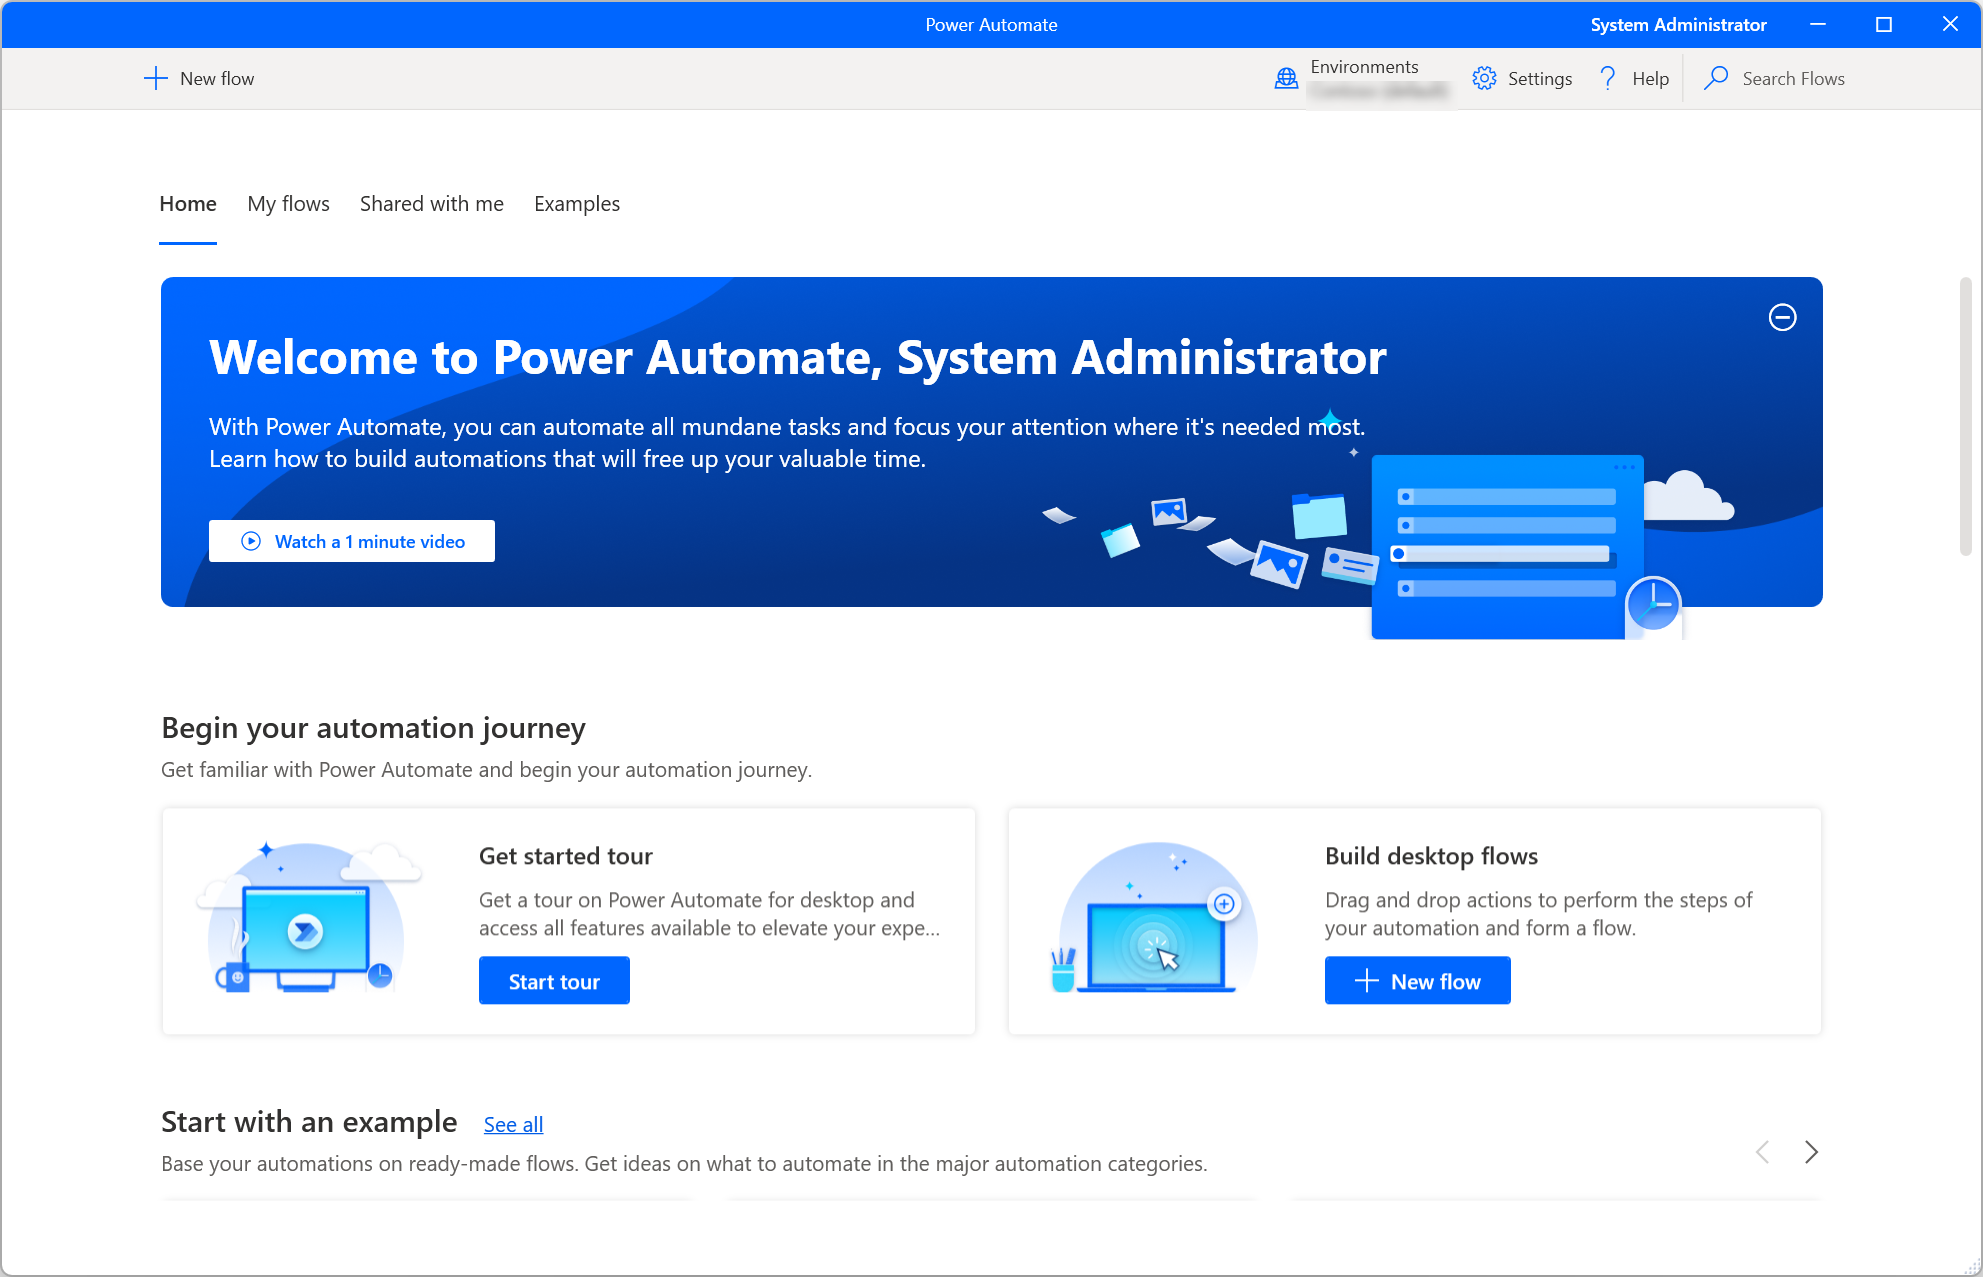
Microsoft Power BI is a widely used business intelligence and reporting platform designed to analyze data and share insights across an organization. It connects easily with Microsoft products, making it a familiar choice for companies already invested in the Microsoft ecosystem.
Power BI allows users to build interactive dashboards and reports using data from multiple sources. Its visualization tools help surface trends, comparisons, and performance indicators in a clear format. Advanced users can take advantage of deeper analytics, while business users benefit from ready-made templates and self-service reporting.
However, Power BI often works best when paired with a broader platform for communication and context. Reports typically live separately from internal updates, documentation, and collaboration, which can limit how insights translate into action unless supported by additional tools.
Key features of Microsoft Power BI
- Data visualization tools: Transforms complex datasets into interactive dashboards.
- Microsoft integrations: Works seamlessly with Excel, Teams, and other Microsoft services.
- Self-service reporting: Enables business users to build reports without heavy IT involvement.
Best for: Organizations already using Microsoft tools that need flexible data visualization and analytics.
3. Tableau
Tableau is known for its powerful data visualization and analytical capabilities. It enables organizations to explore data visually and uncover patterns that may not be obvious through static reports.
With Tableau, users can connect to a wide range of data sources and create interactive dashboards that support deep analysis. Its drag-and-drop interface makes it accessible to analysts, while advanced features support complex data modeling and calculations.
Tableau excels at exploration and insight discovery, but it often requires complementary platforms to share findings effectively across the organization. Without integration into daily workflows, insights may remain limited to analysts and decision-makers.
Key features of Tableau
- Advanced visual analytics: Supports detailed data exploration and trend analysis.
- Broad data connectivity: Integrates with many databases and data sources.
- Custom dashboards: Allows tailored reporting for different use cases.
Best for: Data-driven teams that prioritize deep analysis and visual exploration.
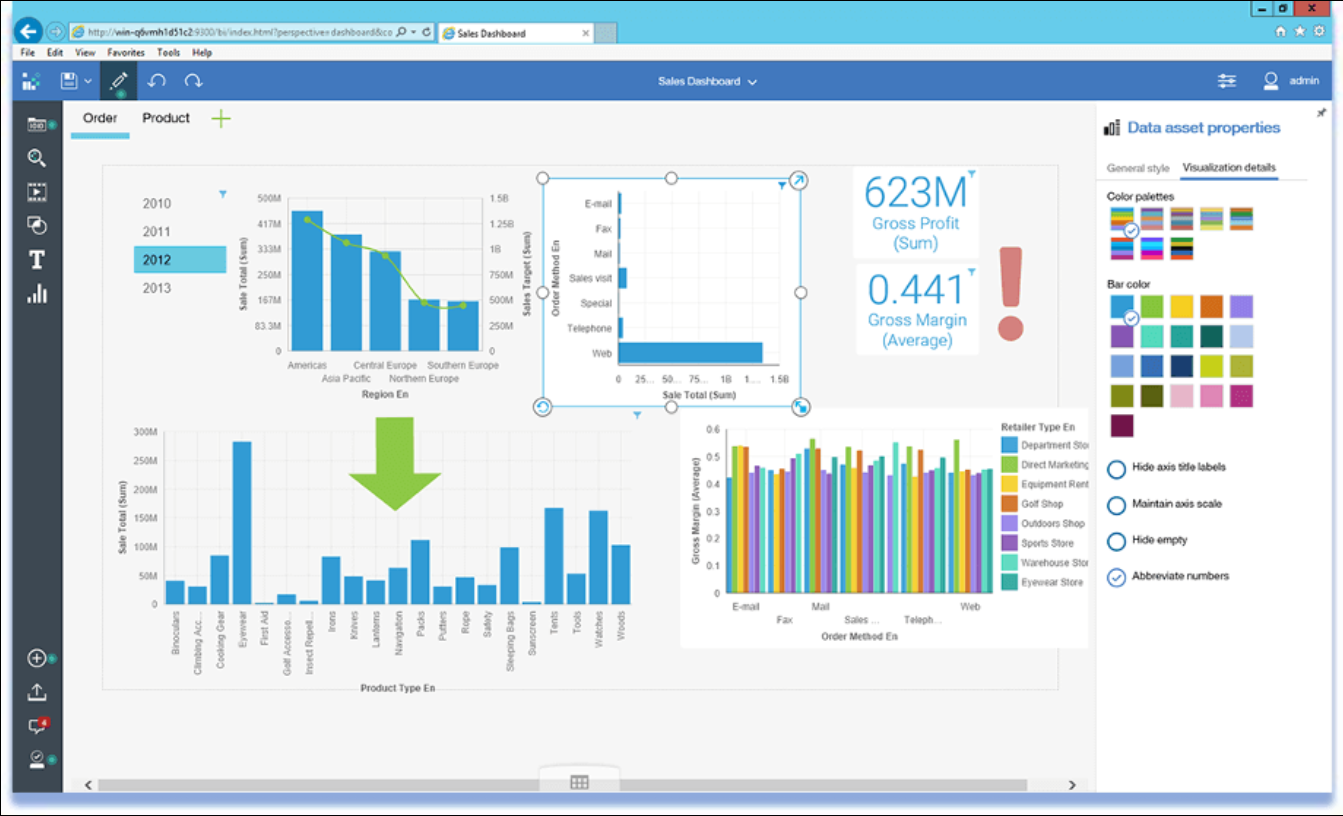
4. SAP Analytics Cloud
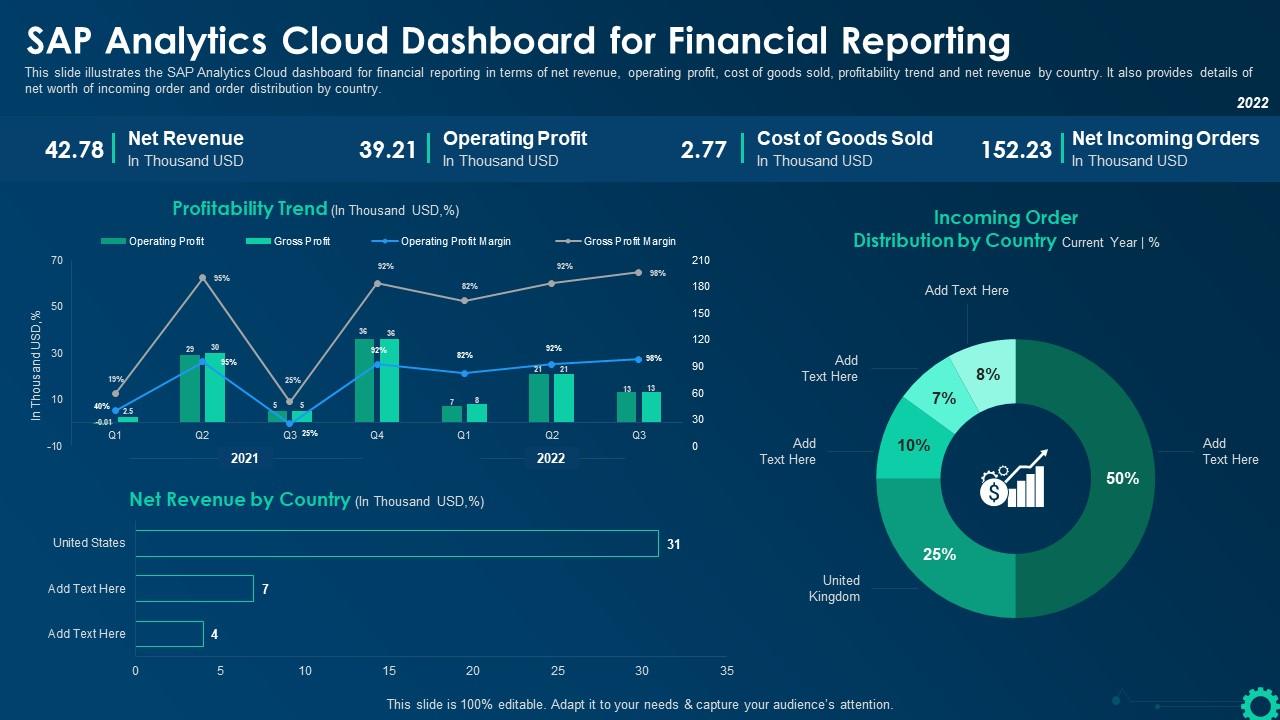
SAP Analytics Cloud combines reporting, analytics, and planning into a single platform. It is designed to help organizations align data insights with forecasting and performance management.
The platform integrates closely with SAP systems, making it a strong option for enterprises already using SAP for finance, HR, or operations. Users can create dashboards, analyze trends, and support planning processes within one environment.
SAP Analytics Cloud offers robust governance and enterprise-grade controls. However, its complexity may require dedicated resources, and organizations often rely on additional platforms to ensure insights reach employees beyond leadership and analytics teams.
Key features of SAP Analytics Cloud
- Integrated analytics and planning: Connects reporting with forecasting and performance management.
- Enterprise governance: Supports compliance, security, and standardized reporting.
- SAP ecosystem integration: Works best within SAP-based environments.
Best for: Large enterprises using SAP that need advanced analytics and planning capabilities.
5. Qlik Sense

Qlik Sense is an analytics and reporting platform built around associative data modeling. It allows users to explore data freely and uncover relationships that traditional query-based tools may miss. This makes it useful for organizations that want flexible, exploratory reporting across multiple datasets.
The platform supports interactive dashboards and self-service analytics, enabling users to drill into data and ask follow-up questions without rebuilding reports. Qlik Sense also emphasizes governed data access, ensuring consistency while still allowing flexibility for business teams.
Like many analytics-first tools, Qlik Sense focuses primarily on insight generation rather than distribution and communication. Without integration into a centralized workplace platform, reports often remain siloed within analytics teams.
Key features of Qlik Sense
- Associative data engine: Reveals hidden relationships across datasets.
- Interactive dashboards: Enables flexible exploration and drill-down analysis.
- Governed self-service: Balances user freedom with data consistency.
Best for: Organizations that need exploratory analytics with strong data governance.
6. Looker

Looker is a cloud-based reporting and analytics platform that emphasizes consistent data modeling. By defining metrics centrally, Looker ensures teams work from the same definitions and logic across reports.
The platform integrates well with modern data stacks and supports embedded analytics. Teams can surface insights within other applications, which helps bring reporting closer to where work happens. Looker’s modeling layer also reduces discrepancies between reports created by different teams.
However, Looker typically requires technical expertise to set up and maintain. Many organizations pair it with platforms like intranets to provide broader access, context, and communication around insights.
Key features of Looker
- Centralized data modeling: Maintains consistent metrics across the organization.
- Embedded analytics: Places insights inside other business tools.
- Cloud-native architecture: Supports modern data environments.
Best for: Data-mature organizations with dedicated analytics resources.
7. Domo
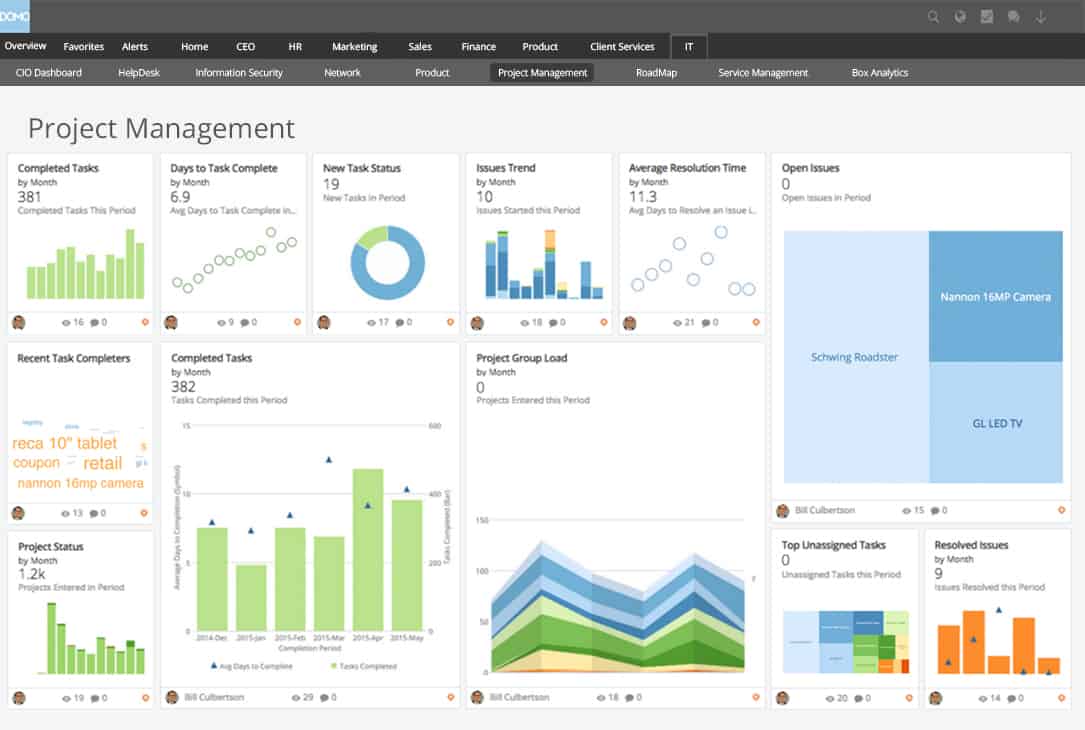
Domo positions itself as a business intelligence platform focused on real-time visibility. It aggregates data from multiple sources and presents it through dynamic dashboards designed for executive and operational use.
The platform emphasizes speed and accessibility. Users can monitor performance metrics, receive alerts, and access reports across devices. Domo also supports collaboration through annotations and sharing, which helps teams respond quickly to changes.
While Domo improves visibility, organizations still need a central hub to tie insights to strategy, documentation, and internal updates. Without that layer, reporting may remain reactive rather than embedded in daily workflows.
Key features of Domo
- Real-time dashboards: Provides up-to-date performance monitoring.
- Broad data connectors: Pulls data from many business systems.
- Mobile access: Supports on-the-go reporting and alerts.
Best for: Teams that need fast, real-time performance visibility.
8. Zoho Analytics
Zoho Analytics offers reporting and business intelligence capabilities within the broader Zoho ecosystem. It enables organizations to create dashboards, reports, and visualizations using data from Zoho apps and external sources.
The platform focuses on affordability and ease of use. Non-technical users can build reports through drag-and-drop tools, while automation reduces manual reporting tasks. Zoho Analytics also supports scheduled sharing and basic collaboration.
For organizations seeking deeper alignment between reporting, communication, and engagement, Zoho Analytics typically works best when complemented by a centralized digital workplace.
Key features of Zoho Analytics
- Self-service reporting: Enables non-technical users to build reports.
- Zoho integrations: Connects seamlessly with Zoho business apps.
- Automated reporting: Reduces manual effort through scheduling and alerts.
Best for: Small to mid-sized organizations using the Zoho ecosystem.
9. Sisense
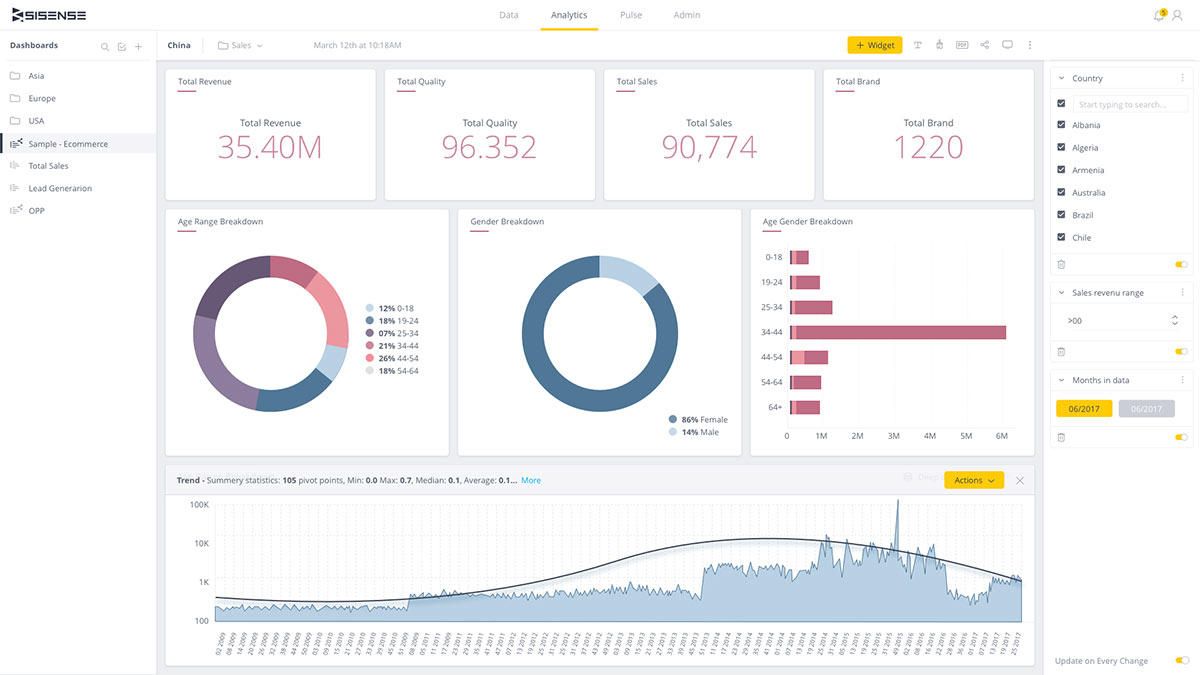
Sisense is a business intelligence and reporting platform designed to handle complex datasets and deliver insights at scale. It supports data preparation, analytics, and visualization within a single environment, making it appealing to organizations with diverse data sources.
One of Sisense’s strengths is its ability to embed analytics into other applications. This allows teams to surface reports within tools employees already use, helping insights feel less detached from daily work. The platform also supports advanced analytics for organizations with more technical reporting needs.
That said, Sisense typically focuses on analytics delivery rather than organizational alignment. To ensure insights translate into action, many teams pair it with platforms that support communication, governance, and broader employee access.
Key features of Sisense
- Embedded analytics: Places reports inside existing business applications.
- Scalable data handling: Supports large and complex datasets.
- Custom visualizations: Adapts dashboards to specific use cases.
Best for: Organizations that need embedded analytics across multiple systems.
10. IBM Cognos Analytics
IBM Cognos Analytics is an enterprise reporting and business intelligence platform with a long-standing presence in regulated and data-heavy environments. It supports reporting, dashboards, and predictive analytics with strong governance controls.
The platform emphasizes consistency and compliance. Standardized reporting ensures leaders and regulators work from the same data definitions, while automation reduces manual reporting tasks. Cognos also supports AI-assisted insights to help users interpret trends.
Its enterprise focus can introduce complexity, and adoption outside analytics or finance teams may require additional enablement. Integrating Cognos insights into a centralized workplace often helps improve visibility and understanding.
Key features of IBM Cognos Analytics
- Enterprise reporting: Supports standardized, repeatable reporting at scale.
- Governance controls: Ensures compliance and data consistency.
- AI-assisted insights: Highlights trends and anomalies automatically.
Best for: Large organizations with strict reporting and compliance needs.
11. Oracle Analytics Cloud
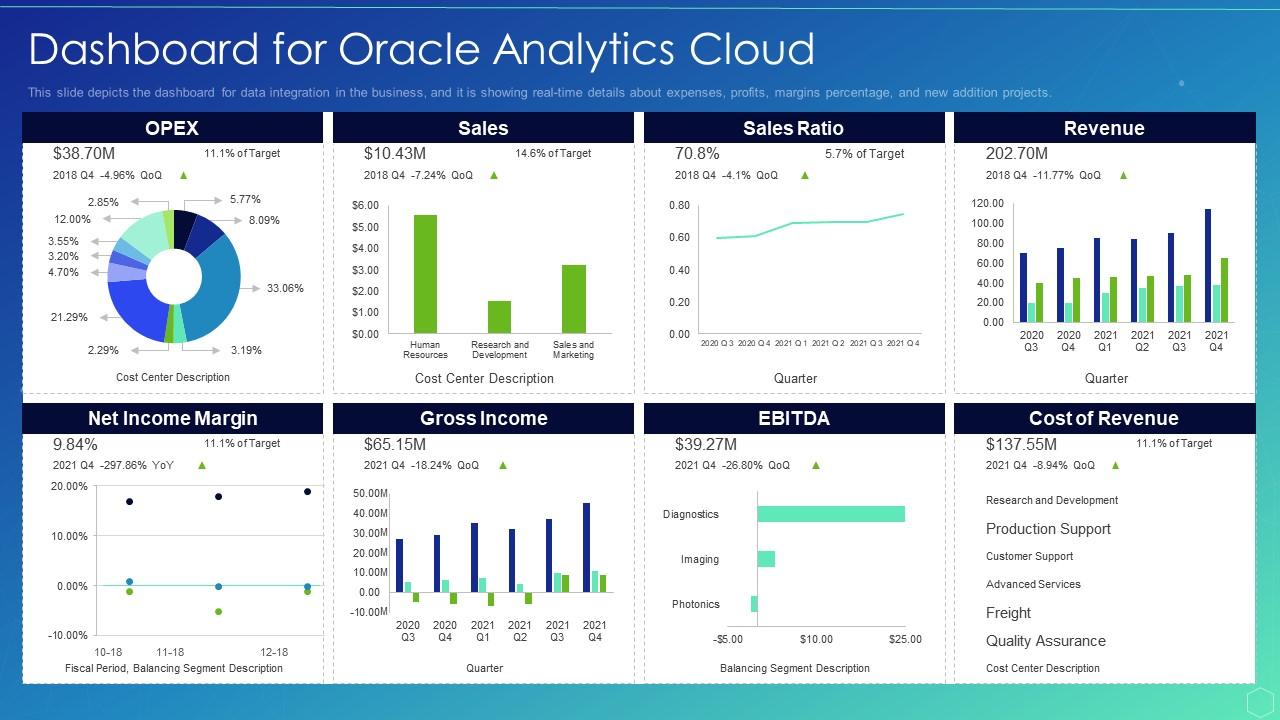
Oracle Analytics Cloud provides reporting and analytics capabilities within Oracle’s broader cloud ecosystem. It supports data visualization, machine learning, and advanced analytics for organizations managing complex data environments.
The platform integrates tightly with Oracle applications, making it a natural choice for organizations already using Oracle for finance, HR, or operations. Users can create dashboards and reports that align with enterprise data models and security standards.
Like many enterprise analytics tools, Oracle Analytics Cloud benefits from being paired with a platform that improves accessibility and communication across teams, ensuring insights do not remain confined to specialists.
Key features of Oracle Analytics Cloud
- Advanced analytics: Combines reporting with machine learning capabilities.
- Oracle integrations: Aligns closely with Oracle business applications.
- Enterprise security: Supports strong access controls and governance.
Best for: Organizations heavily invested in Oracle’s cloud ecosystem.
12. Klipfolio
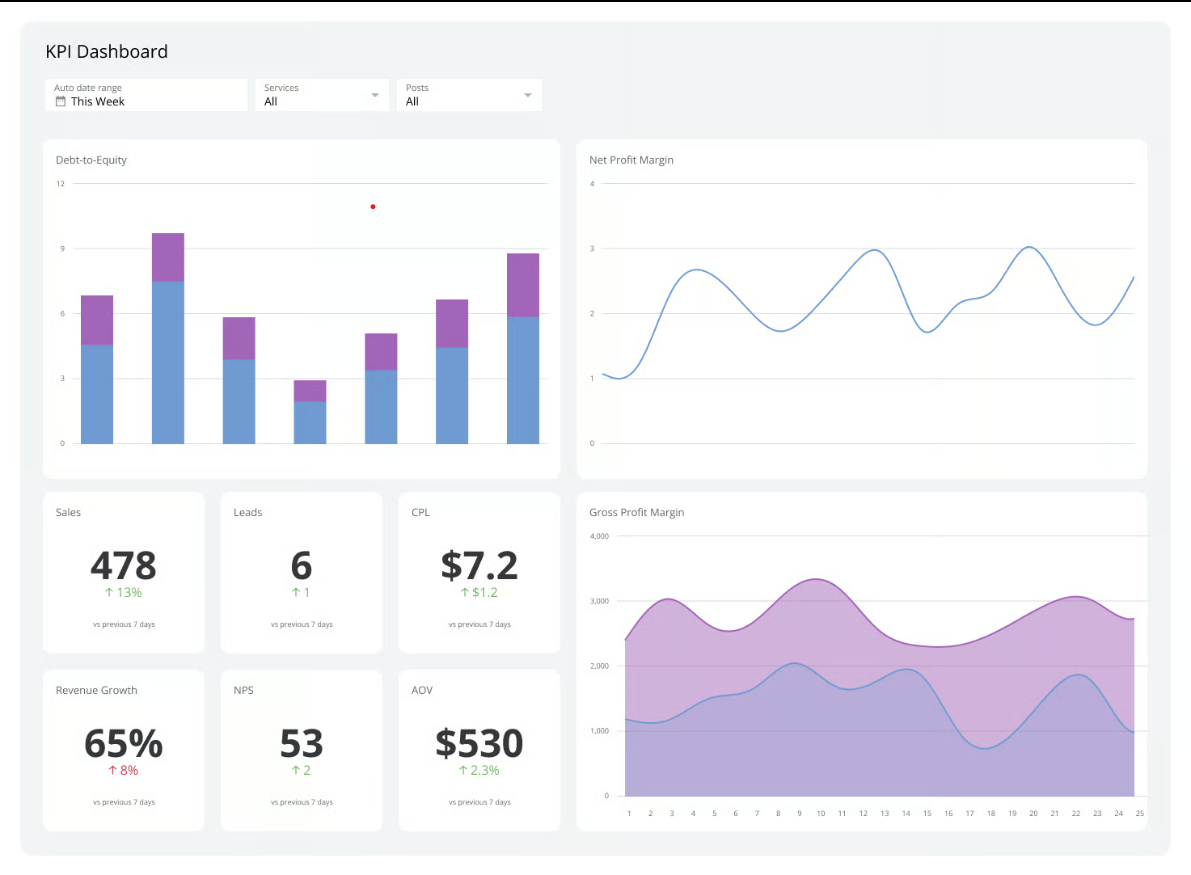
Klipfolio is a reporting and dashboard platform focused on real-time metrics and performance tracking. It is commonly used by teams that want visibility into KPIs without heavy analytics overhead.
The platform connects to a wide range of data sources and presents information through customizable dashboards. Its emphasis on speed and clarity makes it suitable for operational reporting and leadership overviews.
While Klipfolio excels at surface-level visibility, organizations often require additional tools to provide context, documentation, and alignment around the data being displayed.
Key features of Klipfolio
- Real-time dashboards: Displays up-to-date performance metrics.
- KPI tracking: Focuses on operational and executive reporting.
- Broad integrations: Connects with many cloud-based tools.
Best for: Teams that need simple, real-time KPI visibility.
Bringing organizational reporting together
Organizational reporting software plays a central role in how decisions are made, progress is measured, and teams stay aligned. Yet reporting alone rarely drives outcomes. Insights need context, visibility, and a clear path to action.
Many reporting platforms excel at analysis but fall short when it comes to adoption and engagement. When reports live outside daily workflows, they risk becoming background noise. Organizations see greater value when reporting connects directly to communication, documentation, and collaboration.
Axero approaches reporting differently by placing insights inside the digital workplace. This ensures people encounter relevant data as part of their everyday experience, not as an extra destination. Leaders gain clarity, teams stay aligned, and reporting supports action rather than observation.
If you’re evaluating organizational reporting software, consider how well it integrates into how your people actually work. Book a demo today and see how Axero brings reporting, communication, and engagement together in one platform.


 info@axerosolutions.com
 1-855-AXERO-55