

That instinct is wrong in specific, costly ways. A department can go quiet for months before anyone notices — not because the data wasn’t there, but because nobody was looking at that slice of it. Pages go stale slowly enough that employees learn to distrust all of them equally, not just the outdated ones. And when someone eventually asks whether the platform is earning its renewal, “people seem to like it” is the only answer on hand.
This is a practical guide to intranet analytics: the handful of metrics worth tracking, what each one actually tells you, and how to turn what you’re already collecting into decisions instead of a report nobody opens.
What is intranet analytics?
Intranet analytics is the practice of tracking how people actually use your intranet — who logs in, what content they read, what they search for, which departments are engaged, and what they do next — and using that to make decisions about content, communication, and rollout.
It’s narrower than it sounds. Intranet analytics answers questions about your intranet: is it reaching people, is the content useful, is anything missing. It doesn’t measure employee productivity, monitor individual activity, or tell you how long someone spent in a meeting. Those are different products solving different problems.
The practical distinction worth holding onto: web analytics on a public site is about acquisition — getting strangers to arrive. Intranet reporting is about reach and usefulness for an audience that’s already yours. Nobody needs to be persuaded to visit; the question is whether what they find when they get there is worth the trip.
The intranet metrics that actually matter
Active users, split by segment. Monthly and weekly active users as a percentage of total employees — then split it by department, location, and role. The headline number is nearly useless on its own; say a healthy-looking 78% company-wide, which can quietly conceal a single location sitting at 20%. Segmented adoption is, in our experience, one of the most actionable intranet usage metrics available, because it points at a specific team you can go talk to.
Content engagement, not page views. Views tell you a page loaded. More useful: which pages get returned to, which get shared or commented on, which get opened and abandoned in four seconds. A policy page with high views and no repeat visits is probably being found and then bounced from — often because the answer isn’t near the top. Comments and reactions are among the strongest engagement signals you have, because they cost the reader something.
Search behavior — especially failed searches. This is one of the most underused data sources in any intranet, and one of the highest-value. Two lists are worth reading every month: the top queries (what people need most, which tells you what belongs on the homepage) and the queries returning nothing useful. A failed search is a content gap that has already announced itself, with a name and a volume attached. Most intranet teams could fill their content backlog for a year from that one report — as long as your intranet search tool logs those queries instead of just answering them.
Department-level adoption and publishing. Beyond who’s reading: who’s contributing. If four departments publish regularly and eleven don’t, you don’t have an engagement problem, you have a delegation problem — those eleven either lack permissions, lack training, or lack a reason. Contribution data separates “employees don’t care” from “we made it hard.”
Content freshness and ownership coverage. How much of your library is past its review date, and how much has no named owner. This is intranet governance expressed as a number, and it’s the leading indicator among intranet KPIs: freshness decays for months before trust visibly drops, and once employees learn that intranet content might be stale, they route around it permanently. A page-count total that only grows is a warning sign, not a success metric.
Collaboration and social activity. Space activity, discussion participation, document co-editing, event RSVPs, recognition given. These tell you whether the intranet is a place work happens or a place announcements are filed. Both are legitimate, but they’re different products, and it’s worth knowing which one you’ve actually built.
One note on what not to optimize. Time on page is a famously ambiguous metric here: a long visit might mean an engaged reader or a confused one who can’t find the answer. Treat it as a prompt to investigate, never as a target.
From intranet analytics to workplace analytics
It’s tempting to call this a window into how the whole company works. It isn’t — not by itself. The data above describes one system: your intranet.
Broader workplace analytics tries to describe the organization: how communication flows across departments, where collaboration is dense and where it’s thin, which teams are isolated from the rest of the business. Intranet data is a genuine input to that picture — arguably the cleanest one available, since it reflects voluntary behavior rather than survey self-reporting — but it’s an input, not the whole thing.
What intranet analytics can legitimately tell you at that level: which departments are connected to company-wide communication and which are peripheral, where knowledge is being shared across team boundaries versus staying local, and which locations are drifting out of the information flow. That’s real organizational insight and it comes free with the platform.
What it can’t tell you: individual productivity, focus time, meeting load, or app usage outside the intranet. Tools that measure those exist and they’re a separate category. Anyone claiming intranet reporting delivers full workforce visibility is overselling. Where the two do connect usefully is in a shared dashboard — exporting intranet metrics alongside HR and operational data into whatever reporting layer leadership already reads, so they see one picture rather than five.
How to act on the data
Most intranet reports get opened, glanced at, and closed without anything changing. The ones that earn their place are the numbers tied to a specific action. Four moves cover most of what’s worth doing.
Run a content audit from the numbers, not from a spreadsheet of everything. Sort by views against last-updated date. High traffic and old content is your priority queue — those are the pages doing damage if they’re wrong. Zero traffic and old content is your archive queue. You don’t need to review 4,000 pages; you need to review the forty that matter.
Turn failed searches into a content backlog. Take the top twenty queries that return nothing useful and write or fix a page for each. This is the highest-return content work available, because you already know demand exists. Re-check the list next month and watch specific queries drop off it.
Go find the disengaged teams and ask why. Segmented adoption gives you a name; the reason requires a conversation. It’s usually mundane and fixable — no permissions on the space they need, a manager who never mentioned it, work that happens on a shop floor with no shared device. None of those get solved by a better announcement.
Use engagement data to target, not just to report. If a message needs to reach warehouse staff and your data shows they read on mobile between shifts, that changes the format and the channel, not just the send time. Reach data is most valuable pointed forward at the next communication rather than backward at the last one.
And set a cadence. Monthly for search and adoption, quarterly for content freshness and the audit. Analytics reviewed once a year is a report; reviewed monthly it’s a habit that changes what gets published.
How Axero surfaces this
Axero’s intranet software reports on the core of this natively, without a separate analytics product bolted on. Some signals come straight from a built-in report; others, like four-second abandonment or content freshness, are read from the underlying activity and content data rather than a single dedicated dashboard.
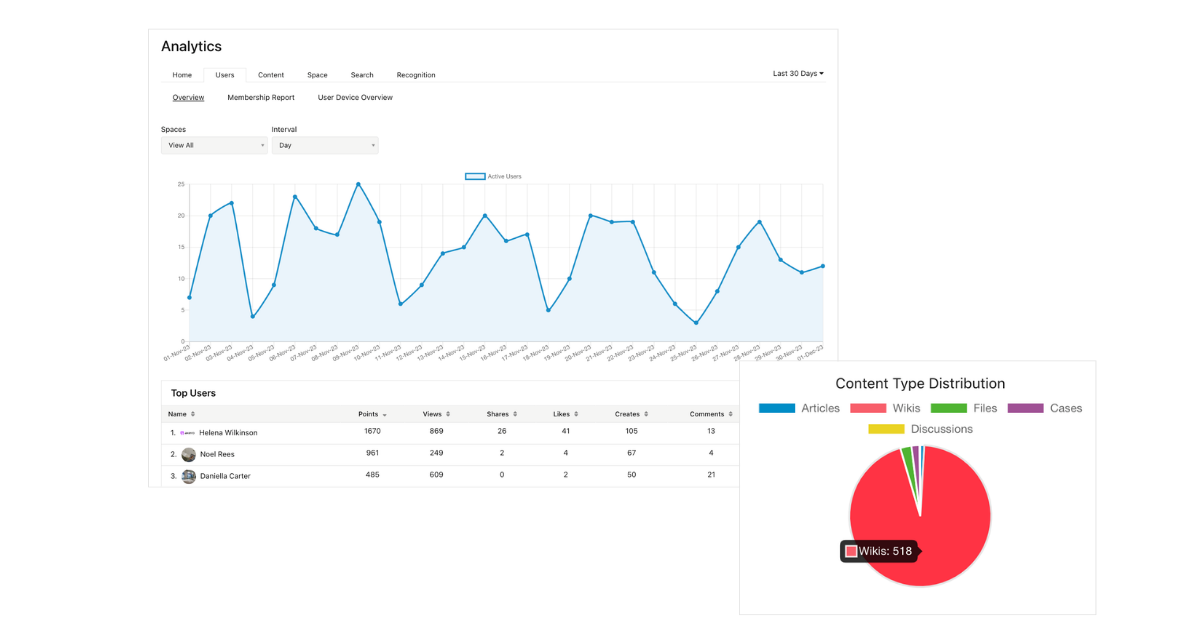
Content statistics break views and engagement down by space, content type, and interval, so you can see whether the growth is in wikis, articles, or events rather than just a single total. Adoption and activity reporting covers logins and participation by user and by space, which is what makes segmented adoption possible. Search reporting exposes what employees are looking for and what they aren’t finding. Read receipts and required-reading confirmations record who has acknowledged specific content — a direct acknowledgement record for the policies or communications where documented receipt matters. And every report exports cleanly, so intranet numbers can sit alongside the other metrics your leadership team already reviews.
For the technical specifics — available reports, fields, and export options — the Axero documentation on analytics goes deeper than a blog post usefully can.
Where to start
You don’t need an analytics strategy to start. Pull two reports this week: adoption by department, and the top failed searches. The first tells you who isn’t showing up. The second tells you what they can’t find when they do.
That’s usually enough to fill a quarter of work, and it’s a better starting point than any dashboard build.
If you’d like to see what this reporting looks like on a real intranet — and what it would tell you about yours — book a demo and we’ll walk through it.