What is an Org Chart?
An organizational chart, or org chart, is a visual representation of a company’s structure, created to outline roles, reporting relationships, and how different departments interact within an organization. Whether hierarchical, flat, or matrix-based, an org chart helps employees understand where they fit in and who they report to.
Why Org Charts Matter
Every business has a structure, even if it’s informal. An org chart brings clarity to that structure by clearly depicting formal relationships within the organization. It shows who is responsible for what, streamlines communication, and helps with decision-making. For HR teams, it’s a critical tool for workforce planning. For employees, it simplifies collaboration and accountability.
Key Components of an Org Chart
Hierarchy and Reporting Lines
An org chart defines how authority flows within a company. Executives sit at the top, followed by middle management, team leads, and individual contributors. This structure prevents confusion over responsibilities. It also shows lateral relationships between colleagues who are on the same level within the hierarchy.
Departments and Roles
Each division within an organization has specific roles. Sales, marketing, finance, IT, and HR often have their own sub-structures within an org chart. This categorization helps teams understand how different departments contribute to the business.
Connections Between Employees
Org charts aren’t just about hierarchy. Similar to a family tree, an org chart can also highlight relationships and connections within the organization. They also highlight cross-functional relationships. A project-based structure, for example, might show employees reporting to multiple managers or teams.
Different Types of Org Charts

Hierarchical Org Chart
This is the most common format of organizational structure. It follows a top-down structure, where decision-making authority flows from executives to employees. Traditional corporations and government agencies often use this model.
Matrix Org Chart
In a matrix structure, organizational charts show employees reporting to multiple managers. For example, a graphic designer might report to both the marketing director and the creative director. This format is common in project-based companies.
Flat Org Chart
Startups and small businesses often use a flat organization chart with few levels of management. It promotes quick decision-making and encourages collaboration across teams.
Functional Org Chart
This model groups employees based on their roles within organization charts. For example, all engineers might report to a chief technology officer, while all accountants report to a finance director.
Divisional Org Chart
Large organizations with multiple product lines or regional offices use this structure. Each division operates like its own company, with its own leadership team.
How Org Charts Help Businesses
Better Communication
An org chart reduces uncertainty by making reporting lines clear. Employees know who to contact for approvals, feedback, or support. By presenting facts clearly, an org chart reduces uncertainty and improves communication.
Improved Decision-Making
With a structured hierarchy, companies can streamline decision-making. Managers delegate tasks effectively, and executives focus on strategy instead of micromanagement. A perfect org chart ensures that decision-making processes are streamlined and efficient.
Workforce Planning
HR teams use org charts to track headcount, plan for future hires, and identify gaps in leadership. It also helps during restructuring or mergers.
Onboarding and Training
New employees can use an org chart to understand their place in the company. It gives them context about teams, managers, and collaboration structures.
Challenges of Maintaining an Org Chart

Keeping it Updated
Companies evolve. Employees leave, departments restructure, and new roles emerge. A static org chart quickly becomes outdated. Using software that can automatically build org charts from existing data can help keep them current.
Complex Reporting Structures
Not all companies have straightforward hierarchies. In cross-functional teams, employees may report to multiple managers, making traditional org charts less effective.
Resistance to Transparency
Some organizations resist publishing org charts due to concerns about hierarchy sensitivity or privacy. Transparency, while beneficial, may require careful handling.
Best Practices for Creating an Effective Org Chart
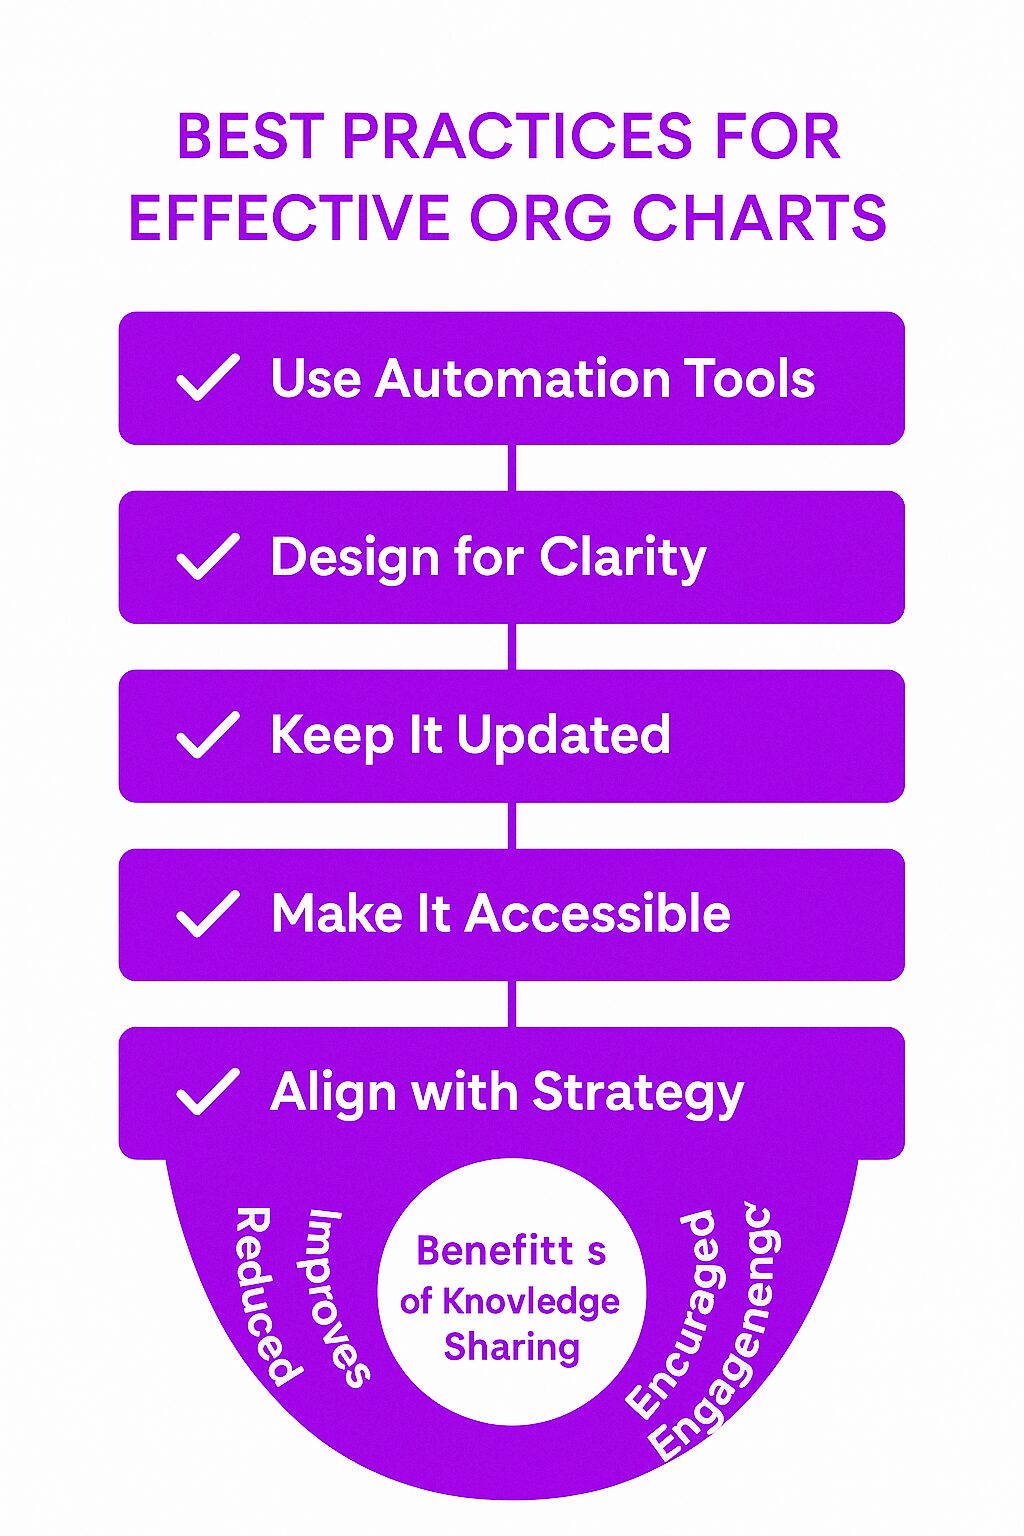
Use Software for Automation
Manually updating org charts is time-consuming. HR software and intranet tools can sync changes automatically, keeping the chart current. Users may need to double click on the SmartArt graphic to access specific design options.
Make it Accessible
Employees should be able to view the org chart easily. Publishing it on the company intranet ensures quick access.
Design for Clarity
A cluttered org chart is useless. Keep it simple, use clear labels, and avoid unnecessary details. Large organizations can use collapsible sections for easier navigation.
Update Regularly
Review the org chart quarterly to reflect new hires, departures, and role changes. Assign someone in HR or management to keep it updated.
Related Concepts
Span of Control
This refers to the number of employees reporting to a single manager. A narrow span means close supervision, while a wide span promotes autonomy.
Chain of Command
The official line of authority within an organization. It determines who makes decisions and who executes them.
Workforce Planning
A strategic process for aligning employees with business needs. It ensures that the right people are in the right roles at the right time.
Org Chart Software
Tools like Microsoft Visio, Lucidchart, and Axero’s intranet solutions help companies create and manage org charts efficiently. These tools utilize advanced graphic methods to create clear and effective organizational charts.
Real-World Use Cases
Corporate Structure
A Fortune 500 company might use a hierarchical org chart to define its executive leadership, middle management, and operational teams. Looking at different examples of corporate structures can provide valuable insights.
Startup Flexibility
A tech startup with a flat structure might use an org chart to show key roles without rigid hierarchies, fostering collaboration.
Healthcare Systems
Hospitals use org charts to outline reporting lines between doctors, nurses, and administrative staff, ensuring clear accountability.
Educational Institutions
Universities use org charts to represent faculty hierarchies, administrative departments, and student services.
Final Thoughts
Org charts bring structure to businesses. Whether traditional or flexible, they provide clarity, improve communication, and support workforce management. Keeping them updated ensures they remain useful tools for employees and leaders alike.